Articles
Untitled Document
urn:nbn:de:0009-29-54531
1. Introduction*
1
Blockchain technology has sparked interest in a variety of industries. Even after the initial Bitcoin hype, blockchain as a technology is still regarded to have the potential to drive decentralization and disintermediation. The cryptographic primitives and consensus mechanisms make storing and transferring of data not only secure and resistant against manipulation but also not reliant on a trusted third party. [1] Consequently, many consider the potential of this technology immense and disruptive.
2
Most commercial blockchain applications rely on a private or a consortium blockchain. The purpose of this sort of blockchain is only to allow a select group of participants to read or write data from or to the ledger. Customer-focused solutions, such as the Diem [2] cryptocurrency, use this approach to keep customer transaction data private [3]. However, depending on the protocol’s configuration, blockchain nodes share data with every other node on the network. The distributed nature of blockchains makes them more failsafe and resistant to manipulation. Attacks such as 50+1 percent attacks and selfish mining, therefore, are well researched. However, with each additional node that joins the network, simultaneously its attack surface for data theft increases. This implies that, even for large networks, only one misconfigured node can leak the whole blockchain data to malicious actors. In business contexts, information about internal structures can be leaked to competitors. For private use-cases, information about the individual transaction structures can give deep insights into personal behavior and contain the most sensitive information.
3
To assess the severity of a data breach on one node of the network, we conducted a study to determine how information can be extracted and visualized to gain as many insights into a private blockchain as possible. Thus, our study reverse engineers parts of blockchain networks to gain the necessary information. Reverse engineering a system is typically used to infer how an underlying mechanism works. The difficulty of reverse engineering systems is determined by the number of their components and the interdependence of their components as well as the number of their settings. [4] For our work, we chose the Ethereum platform as a framework and a popular part of the blockchain universe. Inspired by the Internet Census [5], our approach relies on data reverse-engineered from a security issue in a faulty configuration of Ethereum. Starting there, we conducted four small case studies on different implementations of the Ethereum platform to identify stakeholders and mechanisms of these networks. Building on this, we want to address the following research questions (RQ) in this study:
RQ1: Which methods and tools are required to reverse engineer Ethereum networks?
RQ2: How much information can be extracted from consortium blockchains with one misconfigured node?
4
Our paper addresses managers, lawmakers and scientists who are interested in a more technical evaluation of the security of private blockchains. In this paper, we contribute methods used in the process of reverse engineering, as well as the results of the evaluation. Additionally, we provide the insights we gained from the reverse engineering of blockchain networks and the implications they provide for the adoption of the technology. The rest of the paper is structured as follows: In the next section, we lay the foundations by discussing relevant literature and previous work. We then introduce the methodology as well as the data we used for the analysis. The following chapter contains our main research results, by first providing an overview of the technological side of the market and then a detailed analysis of four different blockchains and their use. The final chapter summarizes and concludes the research.
2. Foundations and Related Work
5
In its very basics, the blockchain is a distributed ledger of transactions autonomously managed by a consensus mechanism. Technically, it can be pictured as a growing chain of linked blocks, from where its name originates. The blocks of a blockchain are stored distributed by the participants, the so-called nodes. [6] This distribution also brings the advantage that no single party could manipulate already stored data and that the storage is resilient against outages of nodes. The blocks of a chain consist of a block header and a list of transactions. In the Ethereum blockchain, each transaction has one sender and one recipient. Today, it is possible to not only store transactions in the blockchain, but also data objects and small programs, which is how (smart) contracts are implemented. [7] In Ethereum, this is often used to realize user-defined tokens. There are many smart contract-based tokens, often standardized by Ethereum Request for Comments (ERC) standards, which define their characteristics and interface.
6
Given all transactions in a network, naturally, a graph can be built to model the interactions of the participants. The nodes of this graph do not necessarily have to correspond to the nodes of the blockchain network and must not be confused. One physical node of the network could, for example, host multiple Ethereum accounts and therefore represent several nodes in the transaction graph. Additionally, the nodes of the transaction graph can be smart contracts as well. There has been a lot of prior research on the technical analysis of blockchains. This research strongly focuses on large public blockchains, analyzing the transaction structure of public blockchains and the usage patterns therein. First analyses were used to deanonymize Bitcoin users. [8] In the early years of blockchain, it was still possible to dissect the whole transaction graph of the first cryptocurrencies. [9] Due to Bitcoins’ transaction structure, it was necessary to apply advanced heuristics to reconstruct and analyze the user graph of the Bitcoin network. [10] There have been fewer studies on the public Ethereum networks. [11] These studies could only link nodes if Ether (the currency of the Ethereum networks) were sent. To consider all transactions, it would be necessary to include the additional network structure that is built by interacting with smart contracts. Studies researching transaction networks of ERC-20 tokens partially deconstructed those structures. [12] Interaction networks within smart contracts can be researched in a similar fashion.
7
The limited existing research regarding the programming interface (JSON-RPC) of a network focuses mostly on the possible attack surface it provides, such as stealing mining reward and denial-of-service attacks, [13] or the use of blockchain-based applications. [14] So far, we could not find any studies that use this interface to map transaction networks or reverse engineer the users and use-cases of private blockchains.
8
In contrast to other security or software engineering related topics, we focus on extracting knowledge for a more research-driven goal. Therefore, our motivation was led by the “Internet Census” of 2012, where the authors used a security vulnerability to create the first full “map” of the internet. Several researchers used this as a foundation, regarding the provided knowledge as well as the used methods, to get insights in other technologies or security-related issues. [15]
3. Materials and Methods
9
To answer our research questions, we used a multiple case study approach. The case study research design consists of the study’s questions, its propositions, units of analysis, the logic linking of the data to the propositions, and the criteria for interpreting the finding. [16] We already posed the research questions in the introduction of this paper. As units of analysis, we chose the block headers and transaction data, as well as the network node data for different blockchains. To identify potential blockchains for a more in-depth analysis, we first created an overview of the Ethereum platform landscape.
10
To do so, we used Shodan, a search engine for Internet-connected devices. We searched the search engine by the query “port:8545” for Ethereum nodes with an active RPC interface. We additionally searched for the string “Ethereum RPC enabled” but considered the results nearly identical. [17] We exported the 3,042 found IP addresses and metadata from Shodan in CSV format. Each IP address represents a node in an Ethereum blockchain network, with an exposed RPC interface. Technically, this gives everyone the possibility to not only extract data from the whole blockchain but also to manipulate the node. It should however be noted that each node in our dataset is for some reason not configured according to the official recommendations, as the RPC interface should never be exposed openly to the internet. Therefore, we only cover blockchains where at least one node was not configured properly.
11
To build our overview dataset on the operation of nodes, we queried the RPC interface of each of the 3,042 nodes. We extracted the chain version, genesis block (i.e., the first block of a blockchain), and information on whether the node was mining or not. To determine the age of each blockchain, we additionally queried the second block of each chain. We decided not to use the timestamp provided in the genesis block since it often provided a zero value in the timestamp. For nodes that are running on the Ethereum main network, we also queried block number 1,920,000 at which the chain splits into Ethereum and Ethereum Classic. We used this as a mechanism to check how valid our data was and how representative our sample of blockchain nodes was.
Our final overview dataset consists of 2,063 active Ethereum nodes, of which 1421 nodes are used in 621 unique blockchain networks and 622 nodes are connected to the Ethereum main network. The network size of the entire Ethereum main network is at the time estimated at 6,900 nodes according to ethernodes.org. [18] As a result, our dataset covers about 9 % of the Ethereum main network. Additionally, we compared how many nodes of the mainnet [19] are operated in different countries and arrived at a very similar distribution, as shown in Figure 1. We did this estimation with other known networks, such as the various Ethereum test networks, which we extracted from an open-source repository for known networks. [20] We arrived at similar results, which lets us conclude that our dataset covers the overall landscape of the Ethereum platform comprehensively.
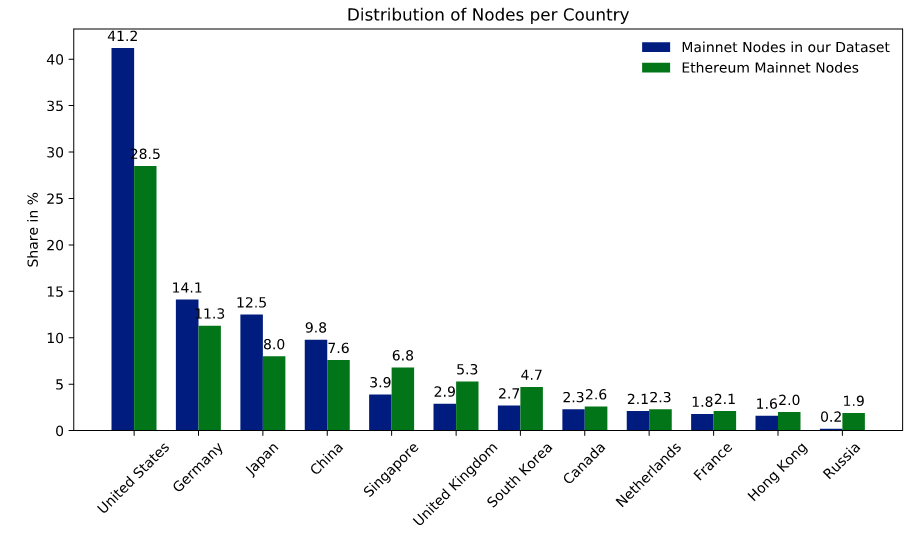
Figure 1: The Distribution of the Mainnet Nodes in our Dataset Compared to all Mainnet Nodes
12
We used the final overview dataset to provide high-level insights into the Ethereum landscape. Additionally, we used this data to identify potential candidates for our case studies. We chose the blockchains according to the number of active nodes, length, and age of the blockchain as well as the distribution of nodes. The goal was to get a diverse set of blockchains to study and draw generalized conclusions. For the chosen blockchains, we extracted account holders for each node and the complete blockchain record of transactions. To identify usage patterns, we used social network analyses on the transaction networks to identify commonly used smart contracts. We extracted and decompiled the smart contracts with the Panoramix decompiler [21] to find out what their role in the blockchain is. While this is a state-of-the-art approach, the decompilation of Ethereum contracts is still in an experimental stage and does not guarantee success. Therefore, we were not able to decompile and analyze all relevant smart contracts. We summarize the overall data extraction process in Figure 2. The mix of source code analysis and social network analysis allowed us to reverse engineer use cases and interaction patterns with the blockchains, and hence provide a suitable way to investigate the proposition.
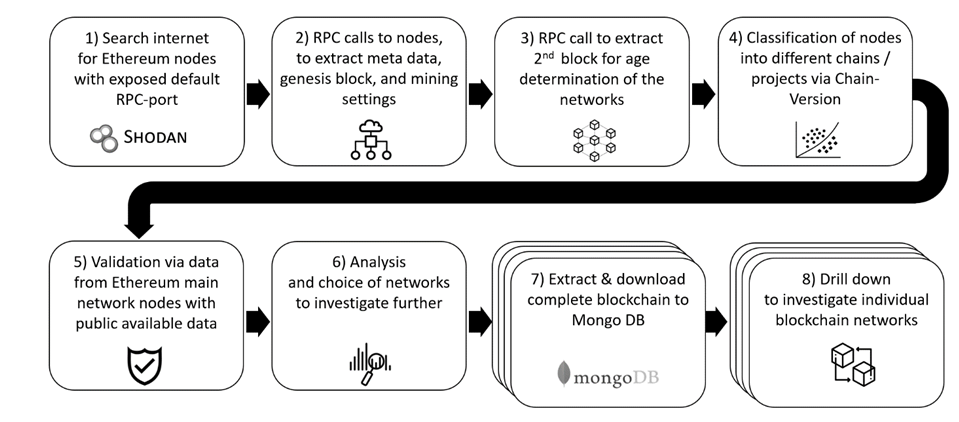
Figure 2: Overall Data Collection Process
4. An Analysis of Business Blockchains within the Ethereum Landscape
13
The primary analysis of this paper consists of two parts. First, we describe the overall landscape of the Ethereum protocol using the overview dataset. From there, we can draw the first conclusions, before providing a more in-depth analysis of four case studies for Ethereum-based blockchains.
4.1. Mapping out the Ethereum Landscape
14
To get an overall view of the Ethereum Landscape and map our findings, we analyzed the metadata from the collected dataset. For further analysis, we have chosen different dimensions, which contribute to our overall goal and give us first useful insights in the Ethereum universe to determine the potential case study candidates later.
15
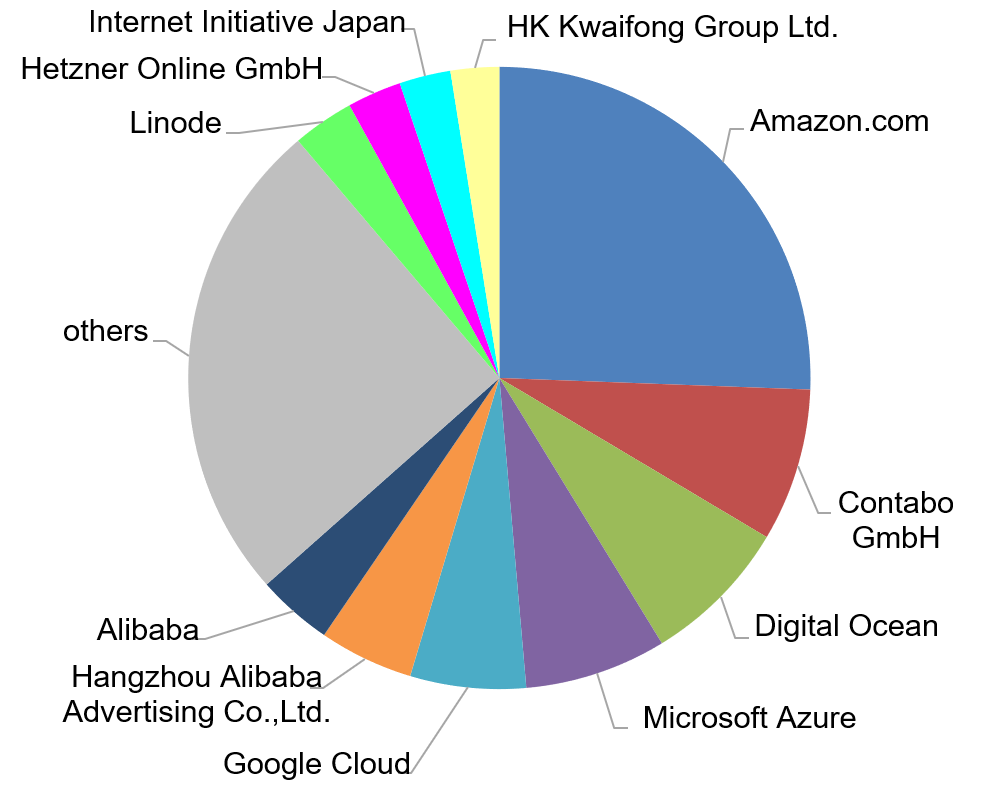
As a first dimension, we analyzed the hosting of the different nodes. Figure 3 (left)shows that almost 75 % of all nodes are hosted by major hosting or cloud providers. With over half of all nodes, the big cloud providers Amazon, Digital Ocean, Microsoft, Google, and Alibaba are claiming a large piece of the Ethereum hosting. This shows that the Ethereum technology shows great potential for business adoption since the cloud setup process is a fast solution to get started. It is an advantage over other technologies, which currently rely on specialized mining hardware that is not widely available.
16
We were surprised by the large share of cloud providers since one of the main advantages of blockchain applications is its distributed topology that affords the technology security and resilience advantages. These advantages are strongly mitigated, when the majority of nodes use the same hosting provider or same data center. [22] To use the full potential of decentralization, blockchain nodes should be hosted on-premise. We assume to see a smaller share of cloud providers in the dataset, once the technology is more adopted.
17
As another dimension, we analyzed the country where the nodes are operating. This analysis should give us a picture where most of the Ethereum projects are implemented and may be used as a hint in which country the technology receives most attention. However, since the nodes are mostly cloud-based, this metric can be skewed. Additionally, because nodes of the same chain can operate in different countries, it was not possible to normalize our analysis.
Figure 3: Distribution of Nodes per Hoster (top) and per Country (bottom)
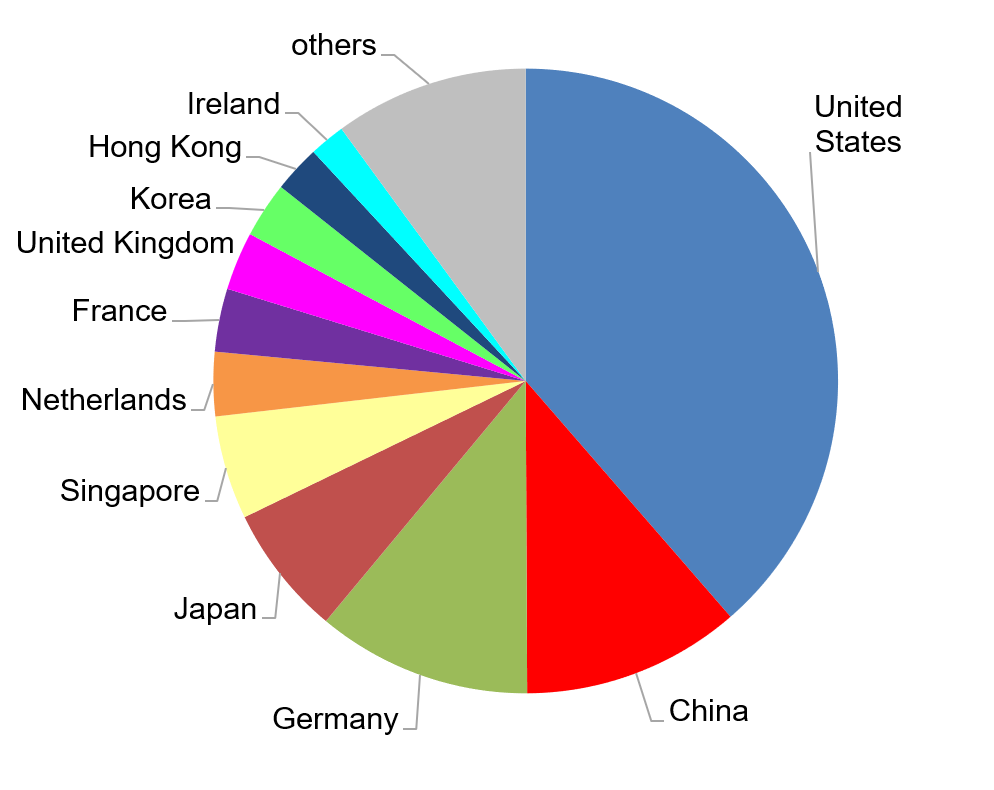
Instead, we have decided to include all nodes in this distribution (Figure 3 (right)) to give a weighted analysis of origin. Therefore, blockchains operating with more nodes increase the respective share of a country. With this knowledge, the chart becomes an activity analysis, showing which country is more active and may have advanced further in the process of adopting Ethereum technology. Yet from this point of view, it is not possible to determine if there are more projects or just networks with more nodes that determine the share of a country.
To determine the state of the different chains and thereby to gain knowledge about the phase in which these projects are, we analyzed the length of the different chains. Figure 4 (left) shows that there are many very short chains. After analyzing and exploring some random samples of these short chains, it showed that these were purely test setups, either with only some test data, partly with less than ten transactions or even completely empty. Extracting information form these projects does not advance this study, and, therefore, we did not consider them in our analyses further. To achieve better knowledge of potential chains, which we could use for further analysis, we analyzed the age of the different implementations. Figure 4 (right) shows the distribution of age, based on the first block. That the initiation of most chains was less than a year ago leads to the conclusion, although the technology is not new anymore, that either projects implementing it are still in an experimental state or that only projects in an early stage still have misconfigured nodes.

Figure 4: Distribution of Blockchain Length (left) and Number of Networks over Time (right)
18
To consolidate our findings, we put the length of chains in relation to their age, illustrated in Figure 5. Newer but longer chains are either configured with a shorter time per block (block time) or represent fast-growing chains. Older but shorter chains were more mature blockchains such as the Ethereum main- and testnets as well as other public Ethereum-based projects. There is a visible forming of “beams” originating from the lower right corner. All networks on the same beam have the same configuration for the block time. There seem to be only a few main variants for this configuration, which could indicate that many of the private Ethereum networks only use a few boilerplate projects as setup. Considering just the distribution and the aggregation of a line in the center, we assume these represent chains with the default configuration. Additionally, increasingly short block times (indicated by a strong negative slope) are introduced in the last years. This could be either due to the need for higher transaction throughput and lower latency or due to the increase in computation power and network speed. A common criticism of the blockchain technology is the high computational overhead and the resulting lack of performance. [23] Blockchains running at a lower block time are less performance-intensive and are less likely to become out of sync. Additionally, when using the proof-of-work consensus mechanism, shorter block times indicate a lower difficulty, and therefore, a higher risk of double-spending attacks in the network. However, since most private blockchains are not based on this mechanism, we do not research this phenomenon further in this paper.
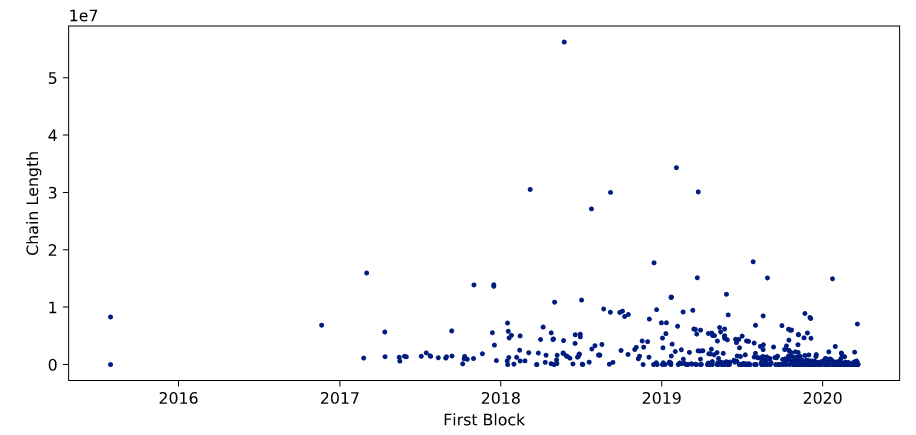
Figure 5: Blockchain Length in Relation to Age
4.2. Detailed Analysis of Consortium Blockchains
19
As shown in the previous section, most of the networks are either not mature enough to research or are inactive. We identified many blockchains with only one active node and some networks with less than ten transactions over the last two years. For our case studies, we chose four blockchains, that all have more than ten active nodes as well as more than 1 million blocks. Additionally, we excluded the large public blockchains, like the Ethereum mainnet and the various public test networks. Table 1 summarizes the networks chosen for analysis.
Table 1: Blockchains for Case Studies
|
Case |
Network ID |
First Block |
Length |
Number of Nodes |
Number of Transactions |
|
1 |
10 |
2019-11-03 |
1,400,000 |
16 |
29,000 |
|
2 |
1337 |
2019-10-22 |
7,500,000 |
20 |
804 |
|
3 |
2894 |
2018-11-04 |
3,200,000 |
13 |
2,700,000 |
|
4 |
159 |
2019-08-18 |
10,500,000 |
19 |
34,000,000 |
4.2.1. Case Study 1: Network ID 10
20
We chose the first blockchain we analyzed for its unique properties. It uses the chain version 10, which could indicate that it uses the Quorum variant of Ethereum. Quorum is being developed by JP Morgan Chase as a blockchain, particularly for financial transactions, and offers additional features for this purpose. The Quorum protocol is designed as a permissioned or private blockchain. [24] The analysis of the transactions revealed an unusual transaction graph. Only 102 addresses were creating a one-to-one pairing of senders and receivers as displayed in Figure 6 (left). More precisely, half of these addresses only sent transactions to a single address, and the other half received transactions from a single address. In all following graphs, accounts are colored blue and smart contracts are colored red. The width of the edges indicates the number of transactions sent from one node to another.
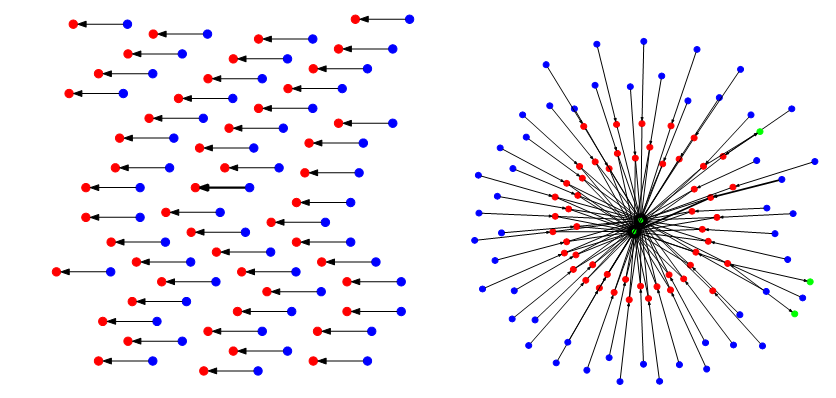
Figure 6: Complete Graph without (left) and with Proxy Contracts (right)
21
This structure led to the assumption that the receivers are all smart contracts with a single user each. We hence queried the nodes for the contract code of the addresses, downloaded, and decompiled the code. The contract provided 22 public functions, most of which are used to manage ownership and access to the smart contract. However, the transactions called only one of those functions named execute, which takes two parameters as input. The first parameter is an address of the contract, which the call is delegated to. The second parameter are the parameters of that contract call. This means that the smart contracts, we identified initially, are so-called proxy-contracts that are used to call other contracts. We expanded the transaction graph by the contracts that were called by the proxy contracts. We show the resulting full transaction graph in Figure 6 (right). The added contracts are colored in green. It can be seen that there are two very central contracts that contain the actual logic, and that every user interacts with. Unfortunately, we were not able to decompile these contracts, and therefore were unable to find out what the purpose of this blockchain network is. However, the overall structure lets us assume that the centralized contracts only accept calls from the proxy contracts and that the proxy contracts are used to manage user access. It should also be noted that the calls to the smart contract are not associated with any cost. Normally deploying or calling a smart contract would cost the user gas [25], which is paid for in Ether. However, the accounts all have a balance of zero Ether and there are no transaction fees in this network. This, along with the fact that the central smart contracts were too complex to decompile, could imply that the developers test a novel use-case that exceeds the current computational limits of standard Ethereum configurations.
22
From a social network perspective, the graph seems very decentralized. Since each user interacts with only one proxy contract, which in turn interacts with at most two other contracts, the out-degree centrality of the nodes is equally distributed between the users. It should be noted that one user sent 87.6 % of all transactions. Additionally, we examined how many blocks were mined by each individual miner. With 85.4 % of all blocks, we do not consider this a secure network, since this miner has over 50 % of mining power. [26] With this much power for one node, it should be reevaluated if a centralized solution could be a better alternative. [27] However, if the network is indeed only a test setup, the security implications are not as important.
4.2.2. Case Study 2: Network ID 1337
23
The second blockchain we identified exhibits a different kind of centralization. While the nodes are distributed all over the world, they are all hosted in the Microsoft Azure cloud. This centralization to a single provider gives a single entity immense power over the network, since it could completely shut down all nodes or simply block access to the nodes on short notice. [28]
24
Furthermore, we noticed that many contracts deployed on the blockchain use smart contracts developed by Ambisafe [29]. Ambisafe offers a blockchain quickstart platform that lets users easily build a blockchain by using preconfigured modules. We identified an EToken2 contract, which offers advanced token functionality but is compatible with the ERC20 interface. Additionally, we identified contracts for identity management (ERC725) and claim management (ERC735). Again, we found proxy smart contracts, but in this case, they were not for access management, but they made contracts upgradeable.
25
The overall network structure looks distributed, as shown in Figure 7 (left). There is one centralized node that interacts with a lot of smart contracts. Approximately a third of these contracts are EToken2 contracts. Each of these contracts corresponds to a contract deployed by the same address that allows transfers of EToken2 to ICAP addresses. These are addresses that are compatible with the IBAN bank account numbers. Another very central node is the smart contract in the upper cluster. This smart contract is a claim management contract. While this looks like the architecture of a decentralized exchange, there is little to no interaction of different accounts with each other, either direct or via smart contracts. Figure 7 (right) shows the transaction graph with a dot layout [30], which indicates that the transactions all flow in only one direction. In addition to this unidirectional transaction flow, the root node holds an overwhelming majority of Ether with approximately 1032 Ether. In comparison, the second largest account holds 18.7 Ether, while most accounts hold less than one.
26
We conclude that this is an experimental setup that is used for testing or demonstration purposes only, or possibly a network that is currently being built and the funds are being distributed to the nodes according to their needs.
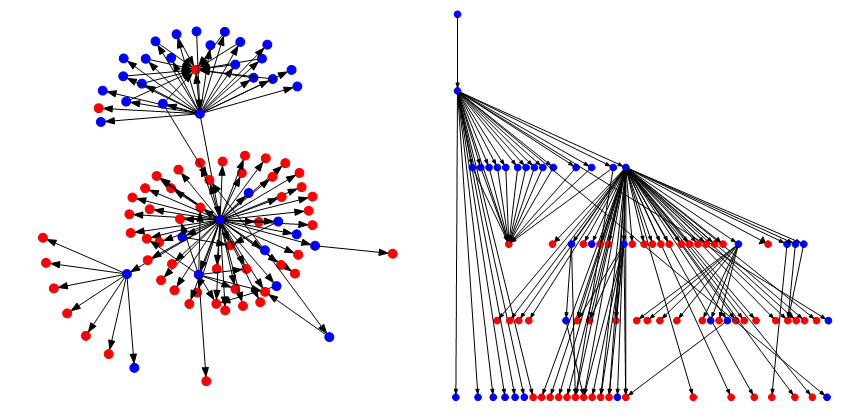
Figure 7: Transaction Graph in Neato Layout (left) and Dot Layout (right)
4.2.3. Case Study 3: Network ID 2894
27
The first insight of our analysis was that there are no smart contracts deployed in this network. This means that the transactions transfer Ether. In fact, the transactions in the network carry on average 2,176.3 Ether.
28
The overall transaction graph is much larger than the previous blockchain. The network consists of 15,489 addresses. This size makes it too complex to display completely. Therefore, we chose the representation of the graph as an approximation in Figure 8 (left) by only displaying edges where there were more than 1,000 sent transactions with the corresponding nodes. The second representation we chose was a transaction graph that only displays those transactions that have data attached in addition to the transaction value, as shown in Figure 8 (right). We could not identify what this data represents since the data seemed to be in the form of arbitrary numbers not correlated with the transaction value. However, there were three different types of numbers: small numbers between 1 and 256, medium numbers around 106, and extremely large numbers in the order of magnitude 1056.
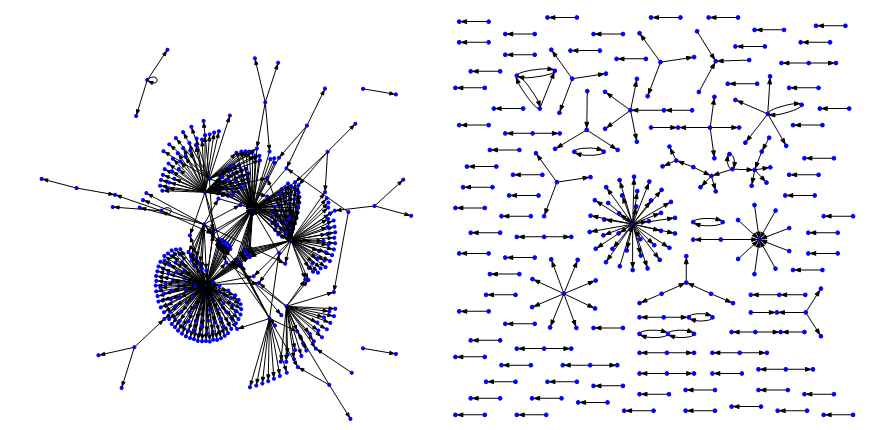
Figure 8: Transaction Graph with nodes with more than 1,000 Transaction (left) and with attached data (right)
Even though the number of nodes is much larger than other networks, the graph is much more centralized. Figure 9 (left) shows the indegree and outdegree centrality for each node. Note that we had to use a logarithmic scale due to the massive differences in centrality. These differences could be as a result of an initial token distribution process. Additionally, the distribution of mining power is not distributed equally either. Figure 9 (right) shows that two miners mined a disproportionally large share of the blocks. While this might not be an immediate problem, if those two miners cooperate, they could overrule the rest of the network. Finally, the distribution of Ether is unequal among the nodes, but it is not nearly as unequal as seen in the previous case study. A large portion of the nodes have one to 108 Ether, but the majority have less than one. The centralized transaction network and mining, as well as the unequal distribution of Ether, are phenomena that can be seen in large public blockchains, in particular because larger networks tend to centralize. This network, despite its use as a pure accounting network, is the most used network in our dataset.

Figure 9: Centrality Scores per Node (left) and Share of Mined Blocks per Miner (right)
4.2.4. Case Study 4: Network ID 159
29
Our last case study concerns a network that has a massive number of transactions. Since it was launched, the network has about 20 % of the public Ethereum mainnet transactions. The Ethereum mainnet is used by thousands of users. However, we noticed a very centralized contract in the network, as shown in Figure 10 (left). We identified it as a TomoChain BlockSigner smart contract [31], which is used as an alternative consensus mechanism. In fact, all smart contracts we identified are used for this mechanism, and the transactions therein are not relevant to the actual transaction network structure. Therefore, we also analyzed the network structure of the remaining network separately as shown in Figure 10 (right). The resulting graph only considers 895 transactions.
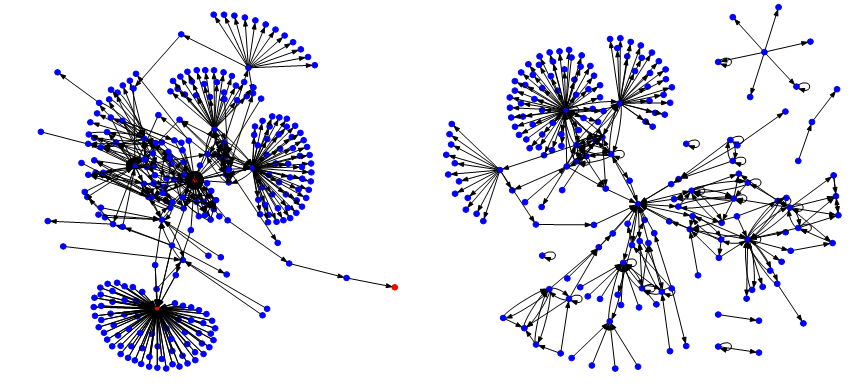
Figure 10: Transaction Structure with (left) and without Smart Contracts (right)
30
This transaction graph is not fully connected. There are some small islands with unidirectional transactions. The main island consists of a few larger clusters of outgoing transactions. Again, this could indicate an initial token distribution process. Since this network is not as old as the previous network we analyzed, it could show much more activity in the future and build a similar transaction graph. Since a smart contract handles the block generation process, we could not easily identify the miners of the blocks, and hence could not analyze the distribution of mining power.
31
Upon further investigation through the IP addresses of the nodes, we found out that the network is connected to the Caelum Project, which is not accessible anymore. It is described as a decentralized storage solution, to secure digital crypto assets [32] with inheritance functionalities. [33]
5. Conclusion
32
Past research on blockchain security has focused mainly on the prevention of fraudulent transactions. However, with the rise of private and consortium blockchains, data privacy has become another important topic, lacking extensive research. Against this backdrop, in this paper, we analyzed the exploitation potential of misconfigured private blockchains. Our approach consisted of reverse engineering actual implementations of the Ethereum platform for individual use-cases to analyze the transaction structure and smart contract implementations, to gain insights into the usage patterns and stakeholders of the networks.
33
In our first research question, we asked, which methods and tools are required to reverse engineer Ethereum networks. Our approach consisted of using a port-scanning dataset and enriching it with additional data that the listed nodes provided. Using social network analyses and source code analyses, we additionally conducted small case studies on selected networks. The social network analysis proved to give useful insights into the actual usage of the network but fell short of revealing the whole structure without the source code analysis of the smart contracts. The smart contract analysis was a very successful approach for some networks, while for others, we could not retrieve the source code of the smart contracts by decompiling them. The main improvement we would suggest for future research would be a “magical” decompiler that can retrieve the original commented source code from Ethereum bytecode. Additionally, it should be checked whether some of the analyses can be automated, to give a quick overview of all networks fast and not rely on analyzing them step by step.
34
Our second research question was how much information can be extracted with only one misconfigured node. We could identify that our approach is not able to paint the full picture of the networks but can give valuable insights. For some networks, we could link IP addresses and specific smart contract structures with publicly available data to get insights of stakeholders. For other networks, we had to rely on the transaction structure and could only identify entities by their cryptographic addresses. Especially for Ethereum networks, each node holds a full copy of the ledger. Therefore, all analyses were based on a maximum of available data. In further research, other structures such as the Hyperledger project should be examined, where the network is segmented into channels. Here, attacking only one node should only provide partial information about the network and would hence call for more elaborated analysis techniques.
35
Due to the availability of data, our research focused on organizational entities rather than individuals. However, the results indicate that for our analysis of the data from an analytical point of view, it does not matter whether the data is of organizational or personal nature. Network structures and agreements can be derived or inferred be it the one or the other. Therefore, we think that the results can be transferred to blockchain networks comprising end users sharing personal data. Thus, our study also raises the very relevant question as to whether (private) blockchain networks can reach a consensus without sharing all data between nodes and what data distribution strategies would defend best against weak links in the chain that exposes private information of individuals.
36
Our dataset consists of over 621 unique blockchain networks, of which we were only able to analyze four for more detailed insights. The process of retrieving and analyzing the entire blockchain for many networks is extremely time consuming, but we are sure that analyzing a larger portion of it would give even better insights into information extraction processes. Overall, improving the systems and tools needed for the reverse engineering as well as a full analysis for the network information, can therefore be future work.
37
The research provided us with an exciting puzzle that is still not assembled completely. We, therefore, hope that the approach is adopted for other blockchain technologies such as Hyperledger or even other unrelated technologies to improve current tools.
This work has been developed in the project PIMKoWe. PIMKoWe (reference number: 02P17D160) is partly funded by the German ministry of education and research (BMBF) within the research program “Industrie 4.0 – Kollaborationen in dynamischen Wertschöpfungsnetzwerken (InKoWe)” and managed by the Project Management Agency Karlsruhe (PTKA). The authors are responsible for the content of this publication.
*by Adrian Hofmann, Fabian Gwinner, Axel Winkelmann, University of Würzburg, Chair of Business Management and Information System and Christian Janiesch, TU Dortmund University, Chair for Enterprise Computing
[1] Satoshi Nakamoto, ‘A Peer-to-Peer Electronic Cash System’ <https://bitcoin.org/bitcoin.pdf> accessed 22 January 2021; Sarah Underwood, ‘Blockchain beyond Bitcoin’ (2016) 59 Communications of the ACM <https://dl.acm.org/doi/10.1145/2994581> accessed 22 January 2021.
[2] Formerly known as Libra.
[3] ‘White Paper | Diem Association’ <https://www.diem.com/en-us/white-paper/> accessed 22 January 2021.
[4] Seungwoon Lee, Seung-Hun Shin and Byeong-hee Roh, ‘Abnormal Behavior-Based Detection of Shodan and Censys-Like Scanning’ (2017) 9. ICUFN <https://ieeexplore.ieee.org/document/7993960> accessed 11 January 2021.
[5] ‘Internet Census 2012’ <http://census2012.sourceforge.net/paper.html> accessed 11 January 2021.
[6] Nakamoto (n 1); Roman Beck and others, ‘Blockchain Technology in Business and Information Systems Research’ (2017) 59 Bus. Inf. Syst. Eng. <https://link.springer.com/content/pdf/10.1007/s12599-017-0505-1.pdf> accessed 11 January 2021.
[7] Kevin Delmolino and others, ‘Step by Step towards Creating a Safe Smart Contract: Lessons and Insights from a Cryptocurrency Lab’ (2016) vol 9604 Lecture Notes in Computer Science <https://doi.org/10.1007/978-3-662-53357-4_6> accessed 22 January 2021.
[8] Fergal Reid and Martin Harrigan, ‘An Analysis of Anonymity in the Bitcoin System’ [2013] Security and Privacy in Social Networks <https://doi.org/10.1007/978-1-4614-4139-7_10> accessed 22 January 2021.
[9] Dorit Ron and Adi Shamir, ‘Quantitative Analysis of the Full Bitcoin Transaction Graph’ [2013] Financial Cryptography and Data Security <https://doi.org/10.1007/978-3-642-39884-1_2> accessed 22 January 2021.
[10] Damiano Di Francesco Maesa, Andrea Marino and Laura Ricci, ‘Data-Driven Analysis of Bitcoin Properties: Exploiting the Users Graph’ (2018) 6 International Journal of Data Science and Analytics <https://doi.org/10.1007/s41060-017-0074-x> accessed 22 January 2021.
[11] Wren Chan and Aspen Olmsted, ‘Ethereum Transaction Graph Analysis’ (2017) 12th International Conference for Internet Technology and Secured Transactions 498; Andra Anoaica and Hugo Levard, ‘Quantitative Description of Internal Activity on the Ethereum Public Blockchain’ (2018) 9th IFIP International Conference on New Technologies, Mobility and Security 1.
[12] Friedhelm Victor and Bianca Katharina Lüders, ‘Measuring Ethereum-Based ERC20 Token Networks’ (2019) vol 1159 Lecture Notes in Computer Science 113; Shahar Somin, Goren Gordon and Yaniv Altshuler, ‘Network Analysis of ERC20 Tokens Trading on Ethereum Blockchain’ (2018) IX Unifying Themes in Complex Systems 439.
[13] X Wang and others, ‘Attack and Defence of Ethereum Remote APIs’ [2018] IEEE Globecom Workshops 1.
[14] Chaehyeon Lee and others, ‘Blockchain Explorer Based on RPC-Based Monitoring System’ [2019] IEEE International Conference on Blockchain and Cryptocurrency 117; Kyungchan Ko and others, ‘Design of RPC-Based Blockchain Monitoring Agent’ [2018] International Conference on Information and Communication Technology Convergence 117.
[15] John Heidemann and others, ‘Census and Survey of the Visible Internet (Extended)’ [2008] ISI-TR-2008-649; Lee, Shin and Roh; (n 3).
[16] Robert K Yin, Case Study Research and Applications: Design and Methods (Sage publications 2017).
[17] ‘Ethereum RPC Enabled - Shodan’ (shodan) <https://www.shodan.io/report/VwRYVIqq> accessed 11 January 2021.
[18] ‘Clients - Ethernodes.Org - The Ethereum Network & Node Explorer’ (bitfly gmbh 2021) <https://ethernodes.org/> accessed 11 January 2021.
[19] Mainnet refers to live blockchain where tokens are in use.
[20] Sebastian Gerske, ‘GitHub - Ethereum-Navigator/Atlas: The Single Source of Truth for All Ethereum Networks.’ <https://github.com/ethereum-navigator/atlas> accessed 11 January 2021.
[21] eevm, ‘Panoramix’ <https://github.com/eveem-org/panoramix> accessed 11 January 2021.
[22] Xiaoqi Li and others, ‘A Survey on the Security of Blockchain Systems’ [2017] Future Generation Computer Systems 841; Deepak Puthal and others, ‘The Blockchain as a Decentralized Security Framework [Future Directions]’ (2018) 7.2 IEEE Consumer Electronics Magazine 18.
[23] Kim, Soohyeong, Yongseok Kwon, and Sunghyun Cho, ‘A Survey of Scalability Solutions on Blockchain’ [2018] International Conference on Information and Communication Technology Convergence 1204.
[24] JP Morgan Chase, ‘Quorum Whitepaper’ <https://github.com/ConsenSys/quorum/blob/master/docs/Quorum Whitepaper v0.2.pdf> accessed 11 January 2021.
[25] Gas measures the amount of work of miners to include transactions in a block.
[26] Nakamoto (n 1).
[27] Karl Wüst and Arthur Gervais, ‘Do You Need a Blockchain?’ [2018] Crypto Valley Conference on Blockchain Technology < https://doi.org/10.1109/CVCBT.2018.00011> accessed 11 January 2021.
[28] Primavera De Filippi and Smari McCarthy, ‘Cloud Computing: Centralization and Data Sovereignty’ (2012) 3.2 European Journal of Law and Technology 1.
[29] ‘Ambisafe | Making Financial Markets Universally Accessible.’ (Ambisfe) <https://ambisafe.com/> accessed 11 January 2021.
[30] John Ellson and others, ‘Graphviz—Open Source Graph Drawing Tools’ [2001] International Symposium on Graph Drawing < https://doi.org/10.1007/3-540-45848-4_57> accessed 11 January 2021.
[31] TomoChain~R&D~Team, ‘OmoChain: Masternodes DesignTechnical White Paper Version 1.0’ (tomochain Pte. Ltd. 2018) <https://tomochain.com/docs/technical-whitepaper--1.0.pdf> accessed on 11 January 2021.
[32] Crypto assets are “a new type of asset recorded in digital form and enabled by the use of cryptography that is not and does not represent a financial claim on, or a liability of, any identifiable entity”. European Central Bank, ‘Crypto-assets – trends and implications’ <https://www.ecb.europa.eu/paym/intro/mip-online/2019/html/1906_crypto_assets.en.html> accessed on 11 January 2021.
[33] ‘Caelum Project’ < https://web.archive.org/web/2020*/www.caelumproject.io > accessed on 11 January 2021.
Fulltext 
-
 Volltext als PDF
(
Size
635.9 kB
)
License 
Any party may pass on this Work by electronic means and make it available for download under the terms and conditions of the Digital Peer Publishing License. The text of the license may be accessed and retrieved at http://www.dipp.nrw.de/lizenzen/dppl/dppl/DPPL_v2_en_06-2004.html.
Recommended citation 
Adrian Hofmann, Fabian Gwinner, Axel Winkelmann, Christian Janiesch, Security Implications of Consortium Blockchains: The Case of Ethereum Networks, 12 (2021) JIPITEC 347 para 1.
Please provide the exact URL and date of your last visit when citing this article.


